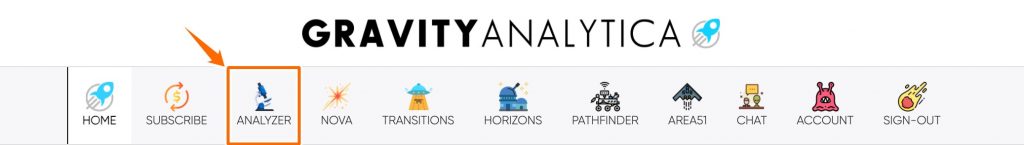
The Stock Analyzer can be reached from the Mission Control Menu Bar.
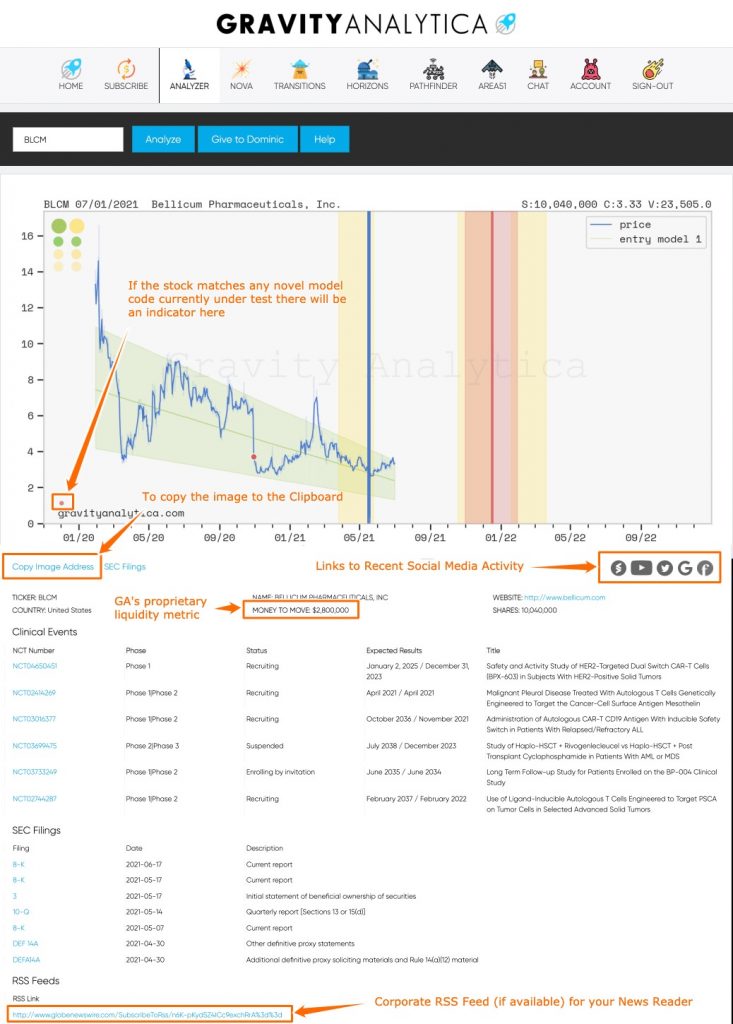
Once on the Analyzer screen, you will be presented with a text box to enter the symbol of choice and Analyze button which will query the API. We currently only support US-exchange listed securities (and ADRs if applicable) in the Analyzer. For Pink tier stocks use the /trips keyword in chat.
At the bottom of the Analyzer screen is a record of all recent searches.
Features of the Analyzer Display
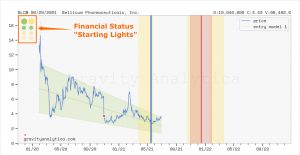
Starting Lights
Current and previous quarters corporate financial health is displayed as starting lights in the top left of the chart. The model process financial information in two different ways, a more conservative analysis is displayed in the right column.
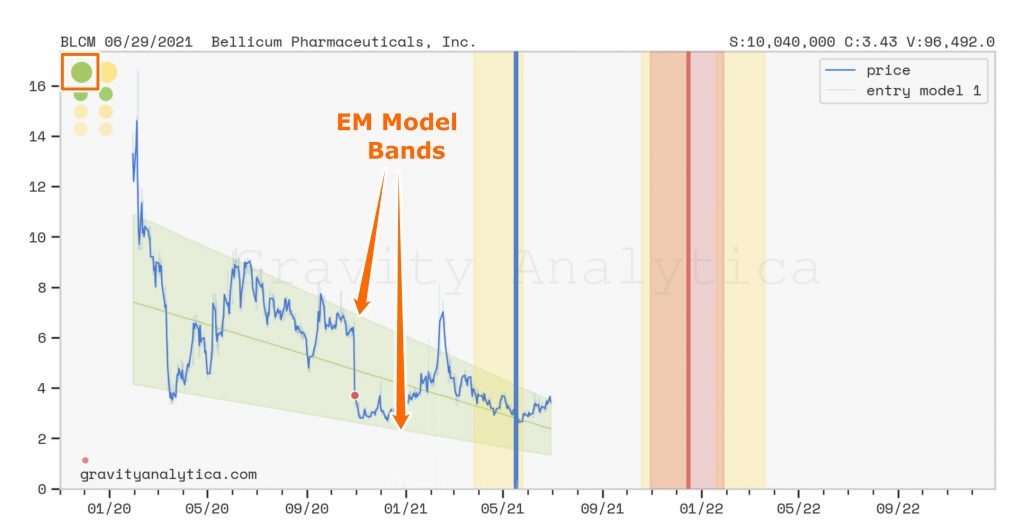
“Risk” EM Band
The EM models Ground State through EM-2 Risks bands are displayed over the price history. The band is color-coded to match the most recent Starting-Light.
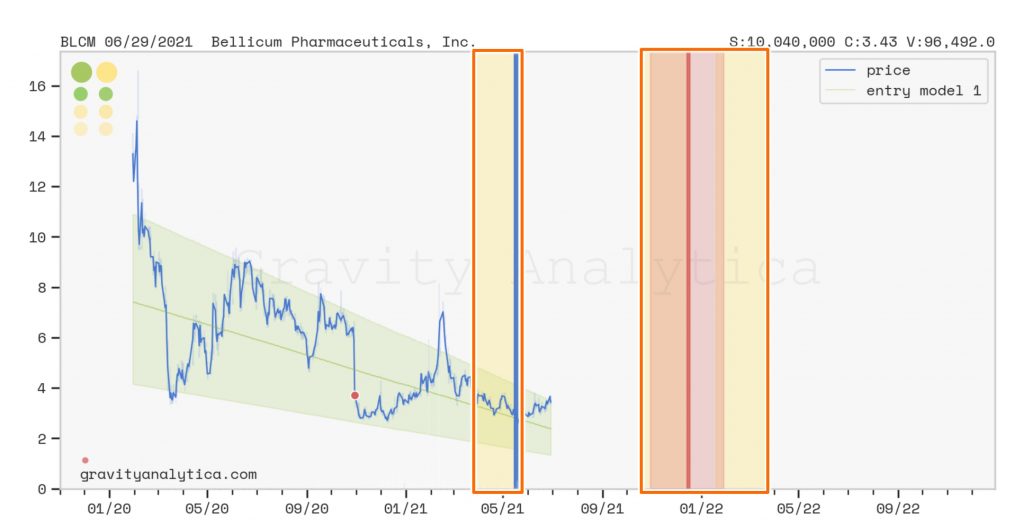
Upcoming “Events”
Events known or predicted from the event-engine are displayed as vertical time windows color-coded to illustrate likelihood of being positive.
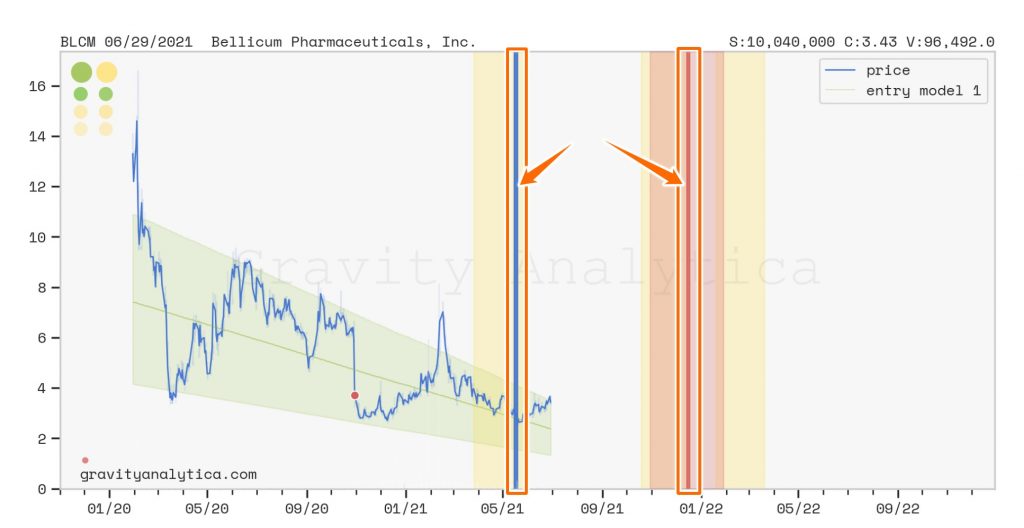
Upcoming Volatility “Events”
Corporate actions, earnings, mergers, etc., events that may or may not coincide with news are marked with solid vertical lines. Earnings are blue and just mark the release date. FSTs (Forced-State Transitions) which are predicted are marked in red with an associated time window.
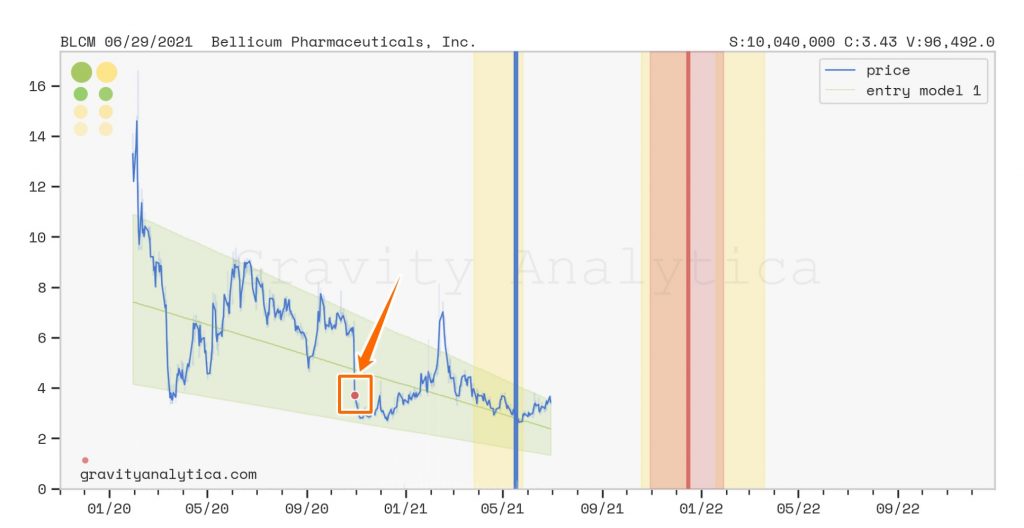
Legacy Corporate Actions
Previously disclosed financial filings are marked on the charts with red dots or dotted/dashed lines. These correspond to Form 13s, 424s or Shelf filing.
We aim to be the only resource hub connecting to any information you may require to make informed decisions. On the Analyzer page you will find direct access other public sources.
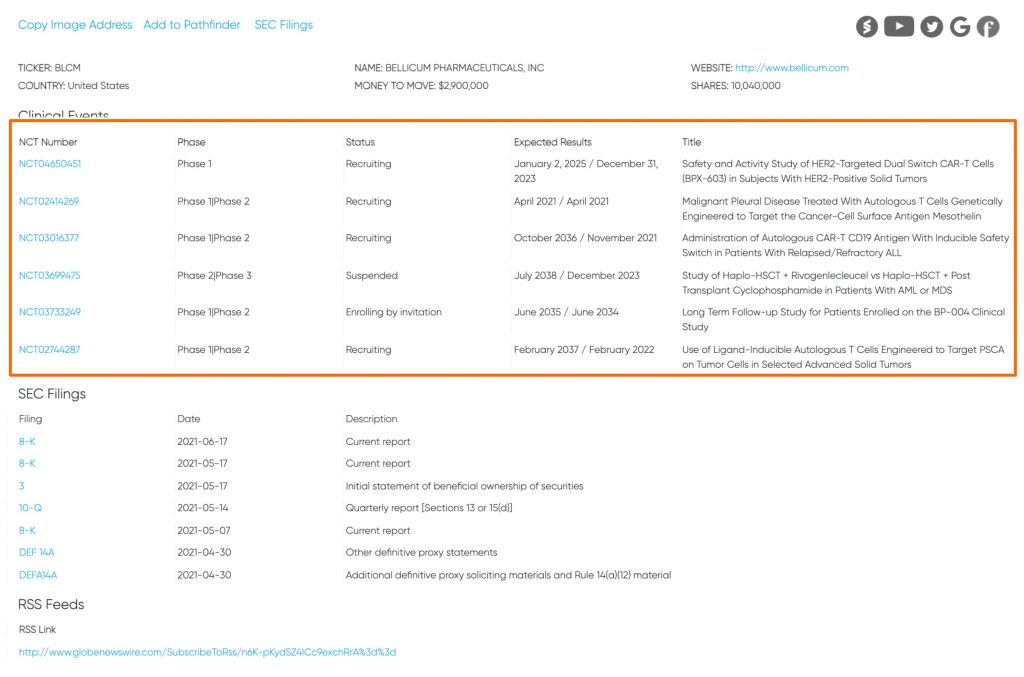
Links to Clinical Trials
Below the chart is displayed any known ongoing clinical trials with links to the trial source.
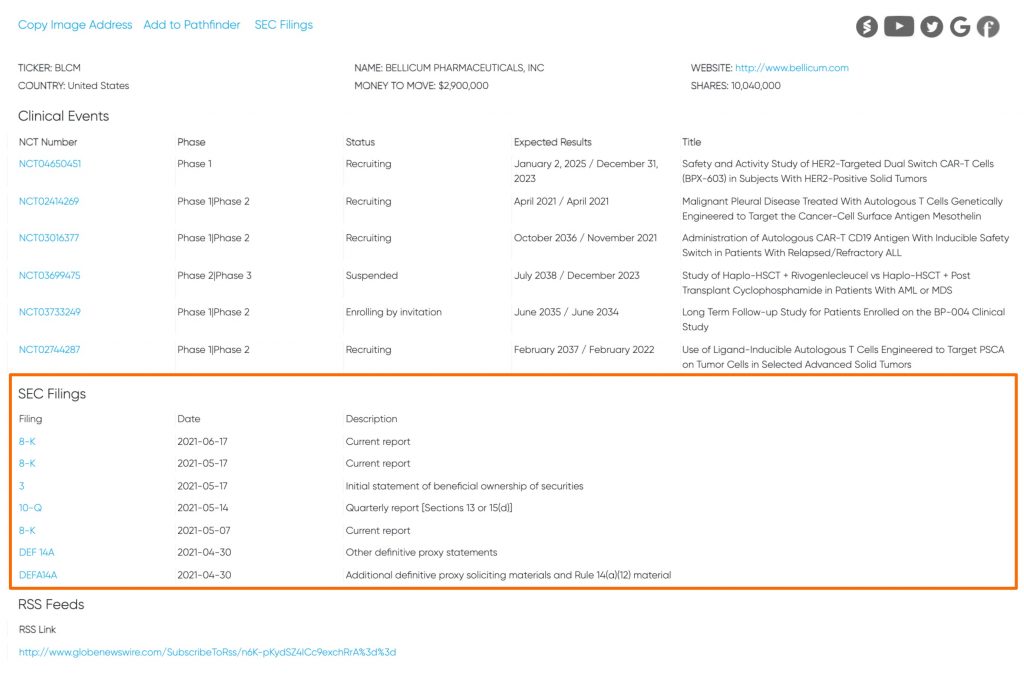
Links to SEC’s EDGAR Database
Beyond financial actions we report on the charts links are provided to all EDGAR filings.
Reverse-Split/Delinquency Risk
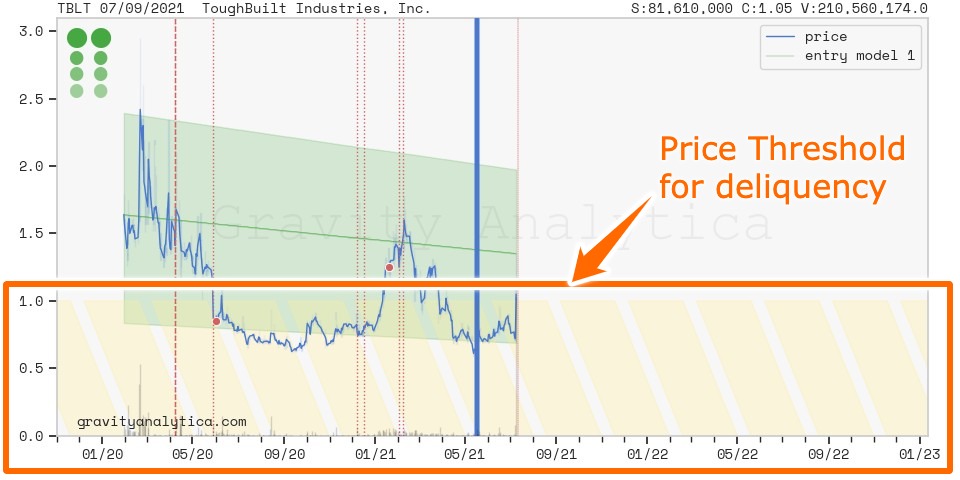
Exchanges have various criteria to remain listed. The $1.00 price threshold at which a stock becomes at risk of undergoing a reverse-split is marked on each chart as a banded yellow strip.
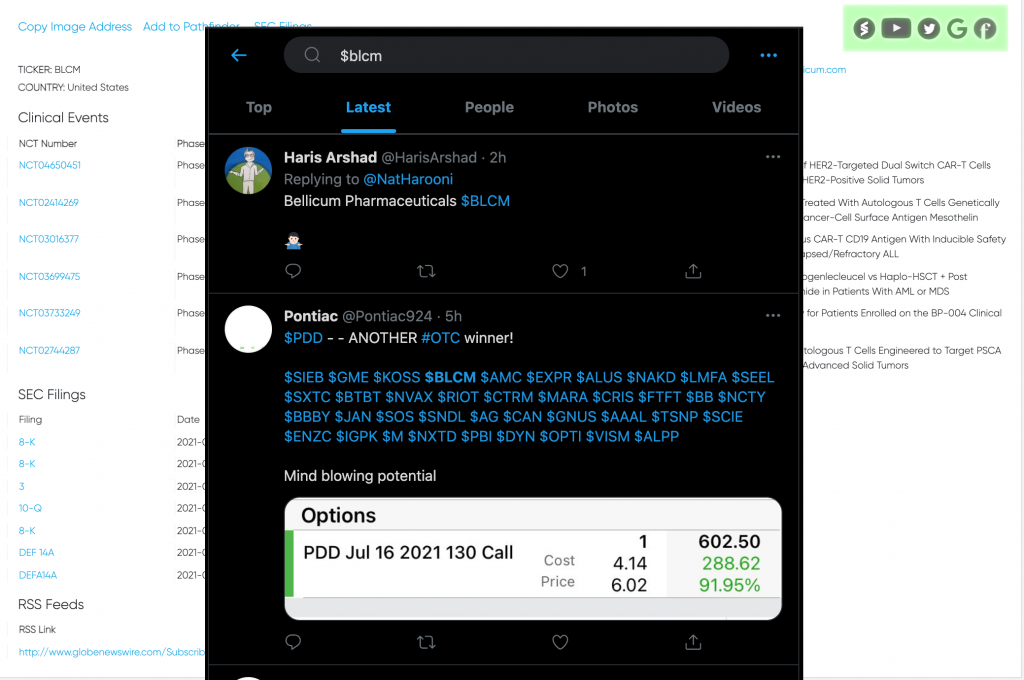
Recent Social Media Activity